Follow the work from a source schedule to staffing, financial performance, and a review decision. Open a view, change an assumption, and trace the result. All records are fictional.
The useful work happens when someone asks why a number changed, which activity is affected, or what the team should do next. This workspace makes those questions explorable.
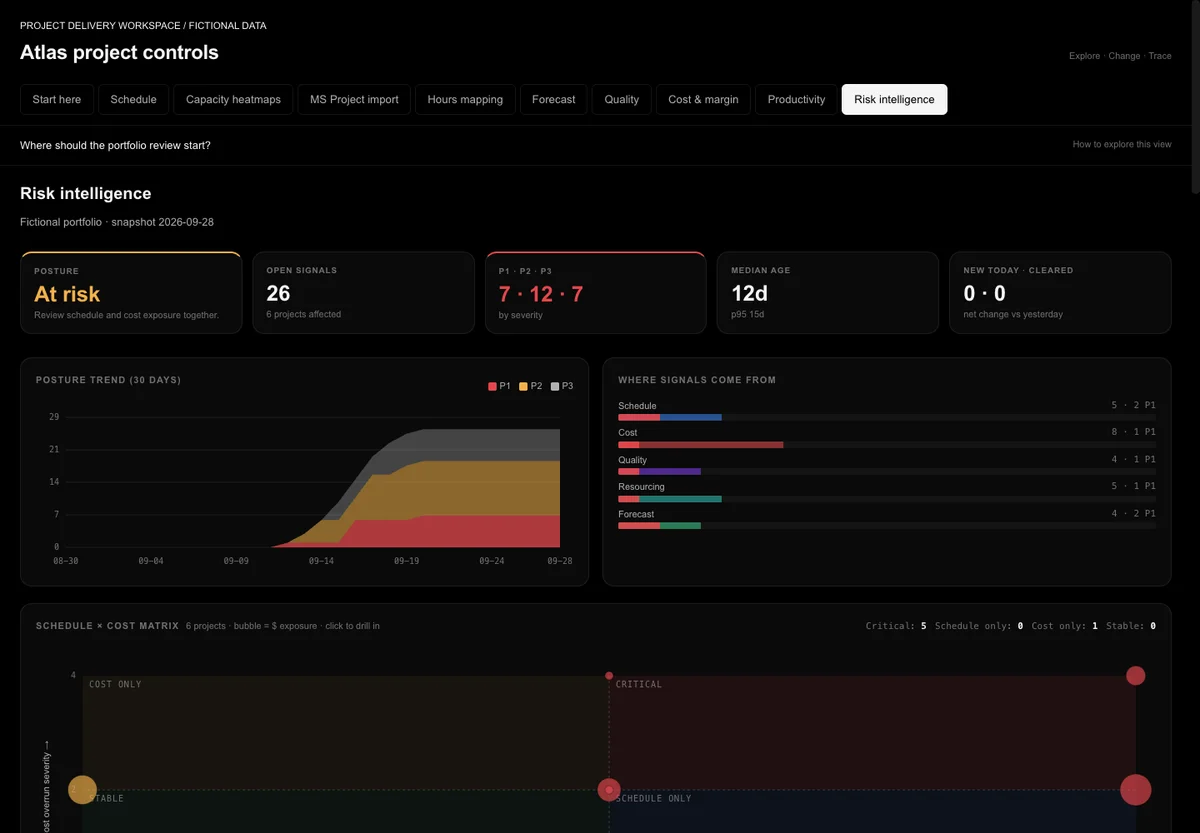
Open the portfolio risk view ↗
01
Bring the schedule into the system
The MS Project pipeline extracts task hierarchy, dates, resource assignments, baselines, and predecessor links. The review step shows what arrived before it becomes a working schedule. Comparing revisions separates added, removed, and changed activities so a revised finish date is visible rather than buried in a replacement file.
Try it: Try parsing both bundled XML revisions. Three configuration activities move by twelve days.
02
Keep planning and performance connected
The Gantt keeps the work breakdown aligned with its timeline. Capacity heatmaps reveal the roles and periods where demand exceeds allocation. Cost and productivity views share a source ledger, so period totals can be checked against the exact entries behind them.
Try it: Switch to cumulative cost, open a plotted amount, and inspect the records through that period.
03
Make review decisions visible
Forecast revisions separate an editable estimate from an approved snapshot. The risk view brings schedule, cost, quality, staffing, and forecast signals into one portfolio review, with response timing and suggested relationships that a reviewer can confirm or dismiss.
Try it: Change remaining hours, approve a snapshot, then open a revision. The earlier approved values remain available.
What this example includes
Adapted application code includes the WBS/Gantt, heatmap grid, financial and productivity charts, quality chart, full risk page, matching logic, hierarchy mapper, version comparison, and Python parser. The portfolio uses fictional scenarios and local review state; it does not connect to client systems.